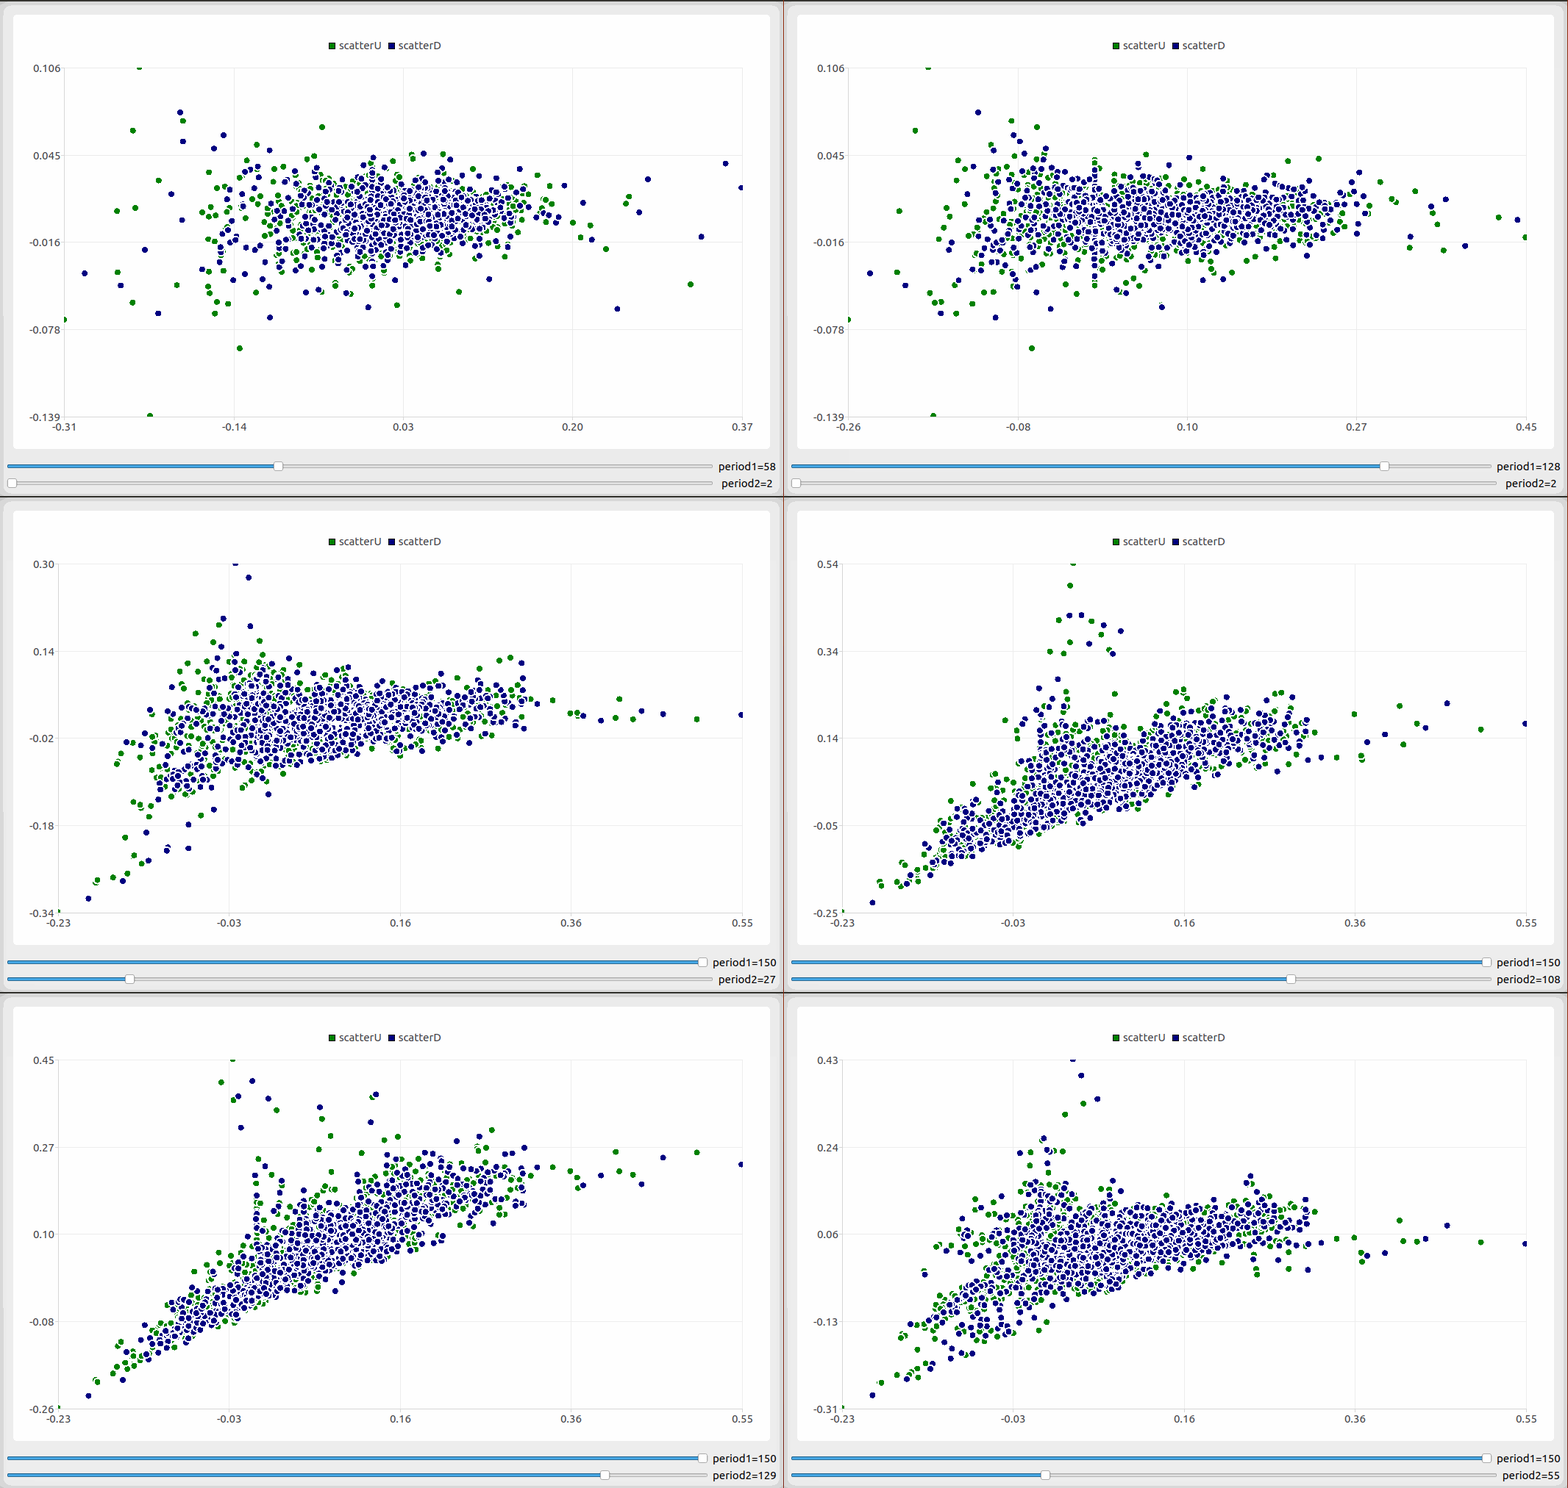
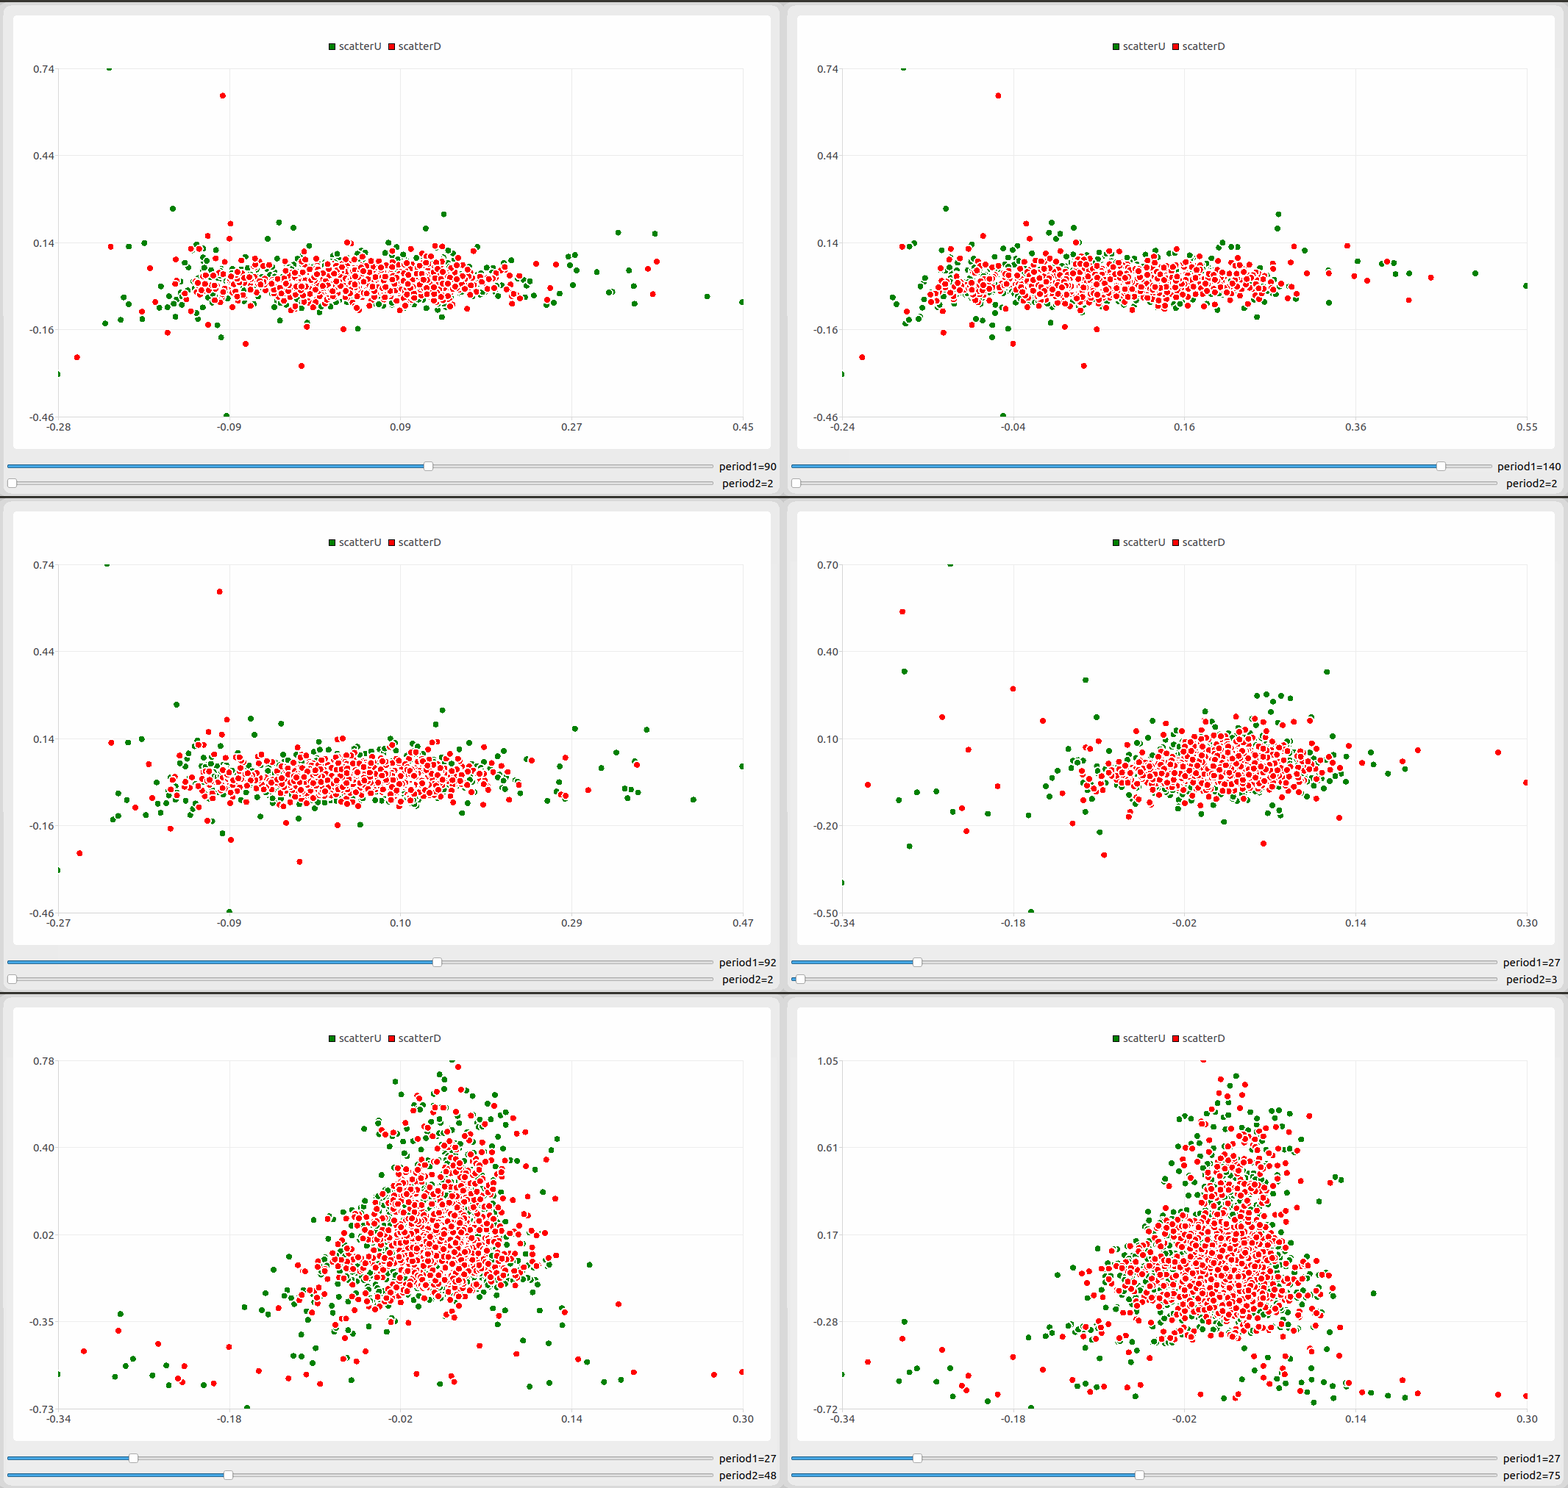
class Main2Period: creates two increments from a financial instrument with different and dynamically
variable periods with a shift of one.One increment on the x axis, the other on the y axis. If the value was
growing, then the dot is green, the falling value of the dot will be blue.
By adjusting the first and second periods, we select the optimal values for separating the points.
Following libraries are used: PyQt5, numpy, sklearn, scipy, pandas_datareader.
News:
04.03.2022 posted "class Main2 Period" the class is in the file scatter_2period_.py
04.03.2022 posted "class Main2Market" the class is in the file scatter_2period_.py
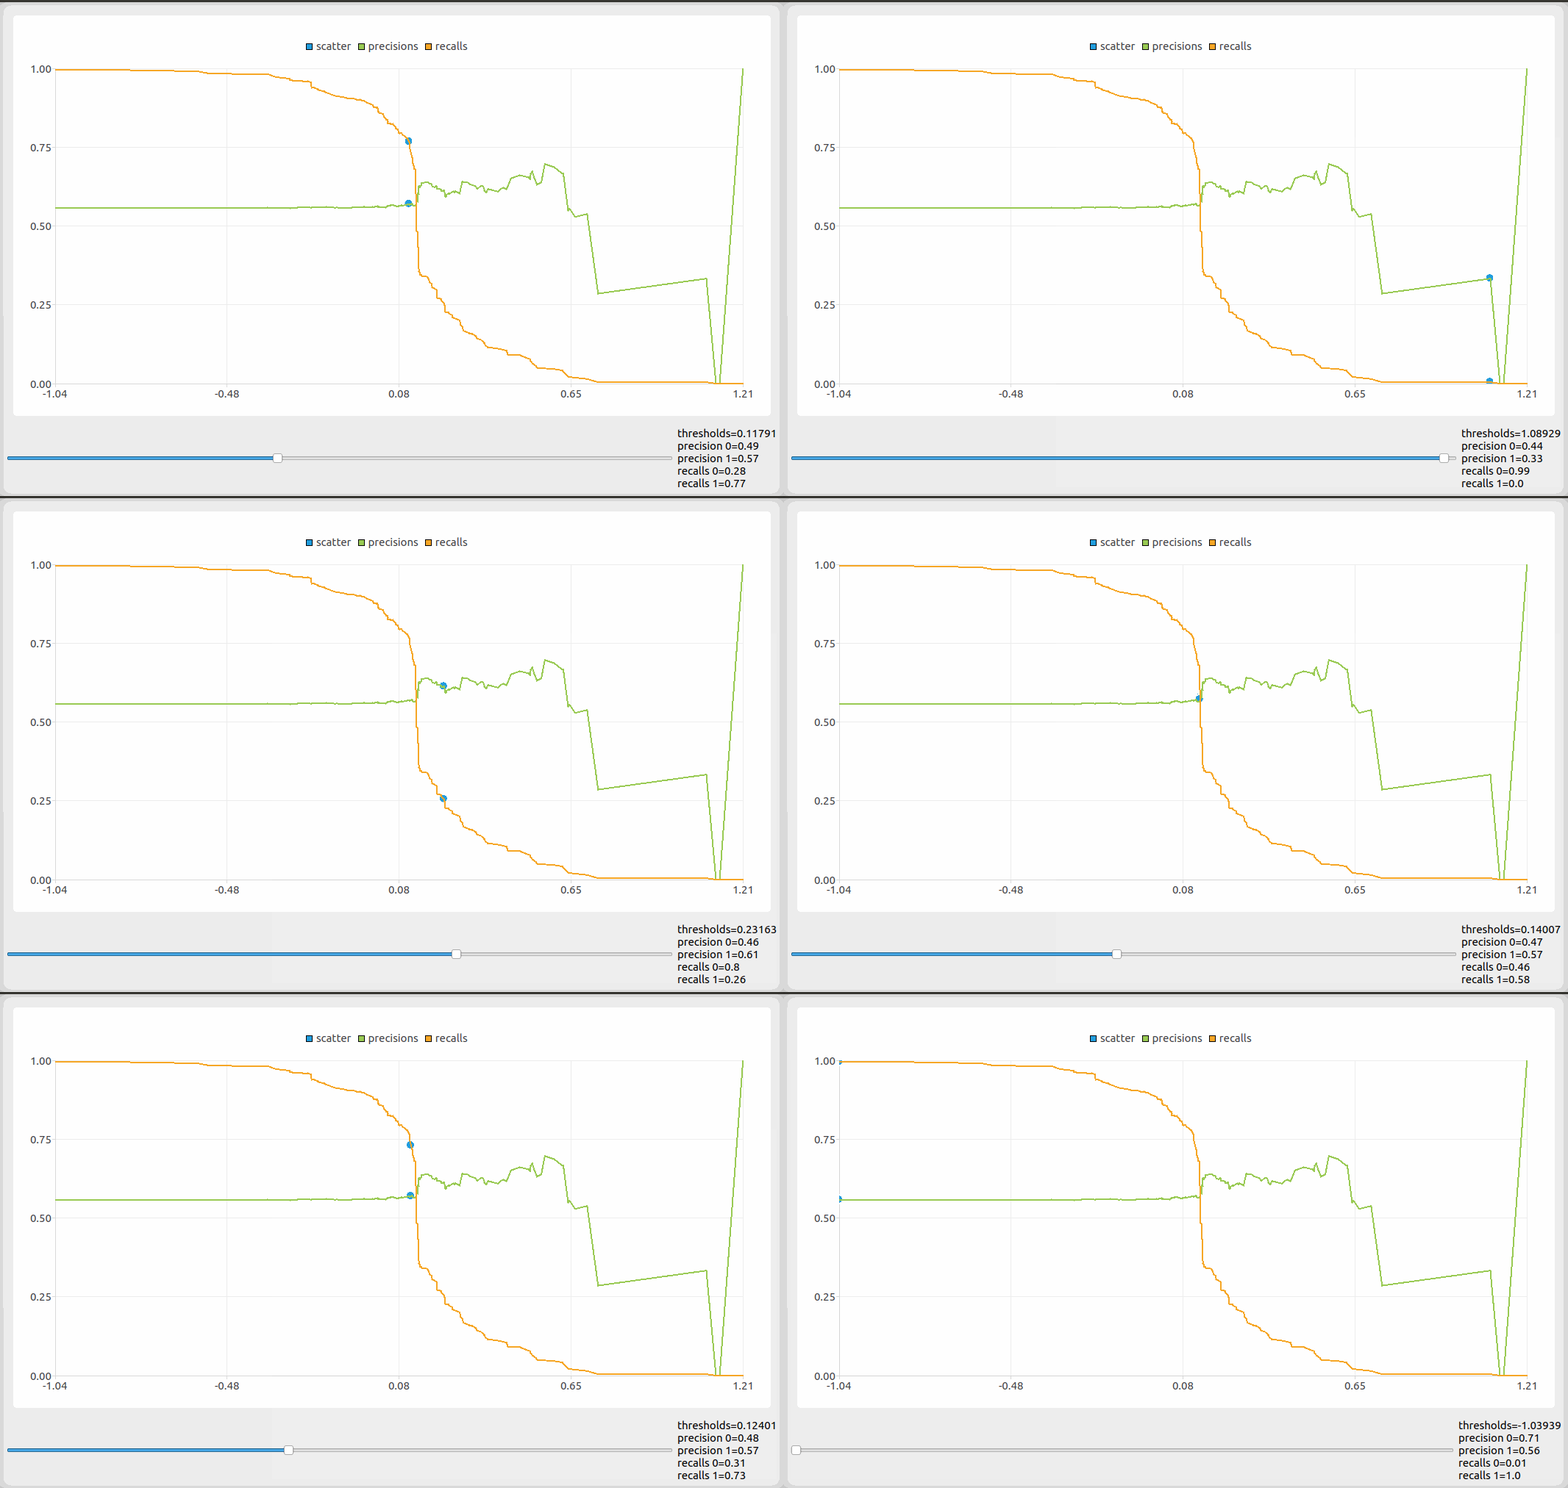
04.03.2022 posted "class curve_prec_rec" the class is in the file scatter_2period_.py
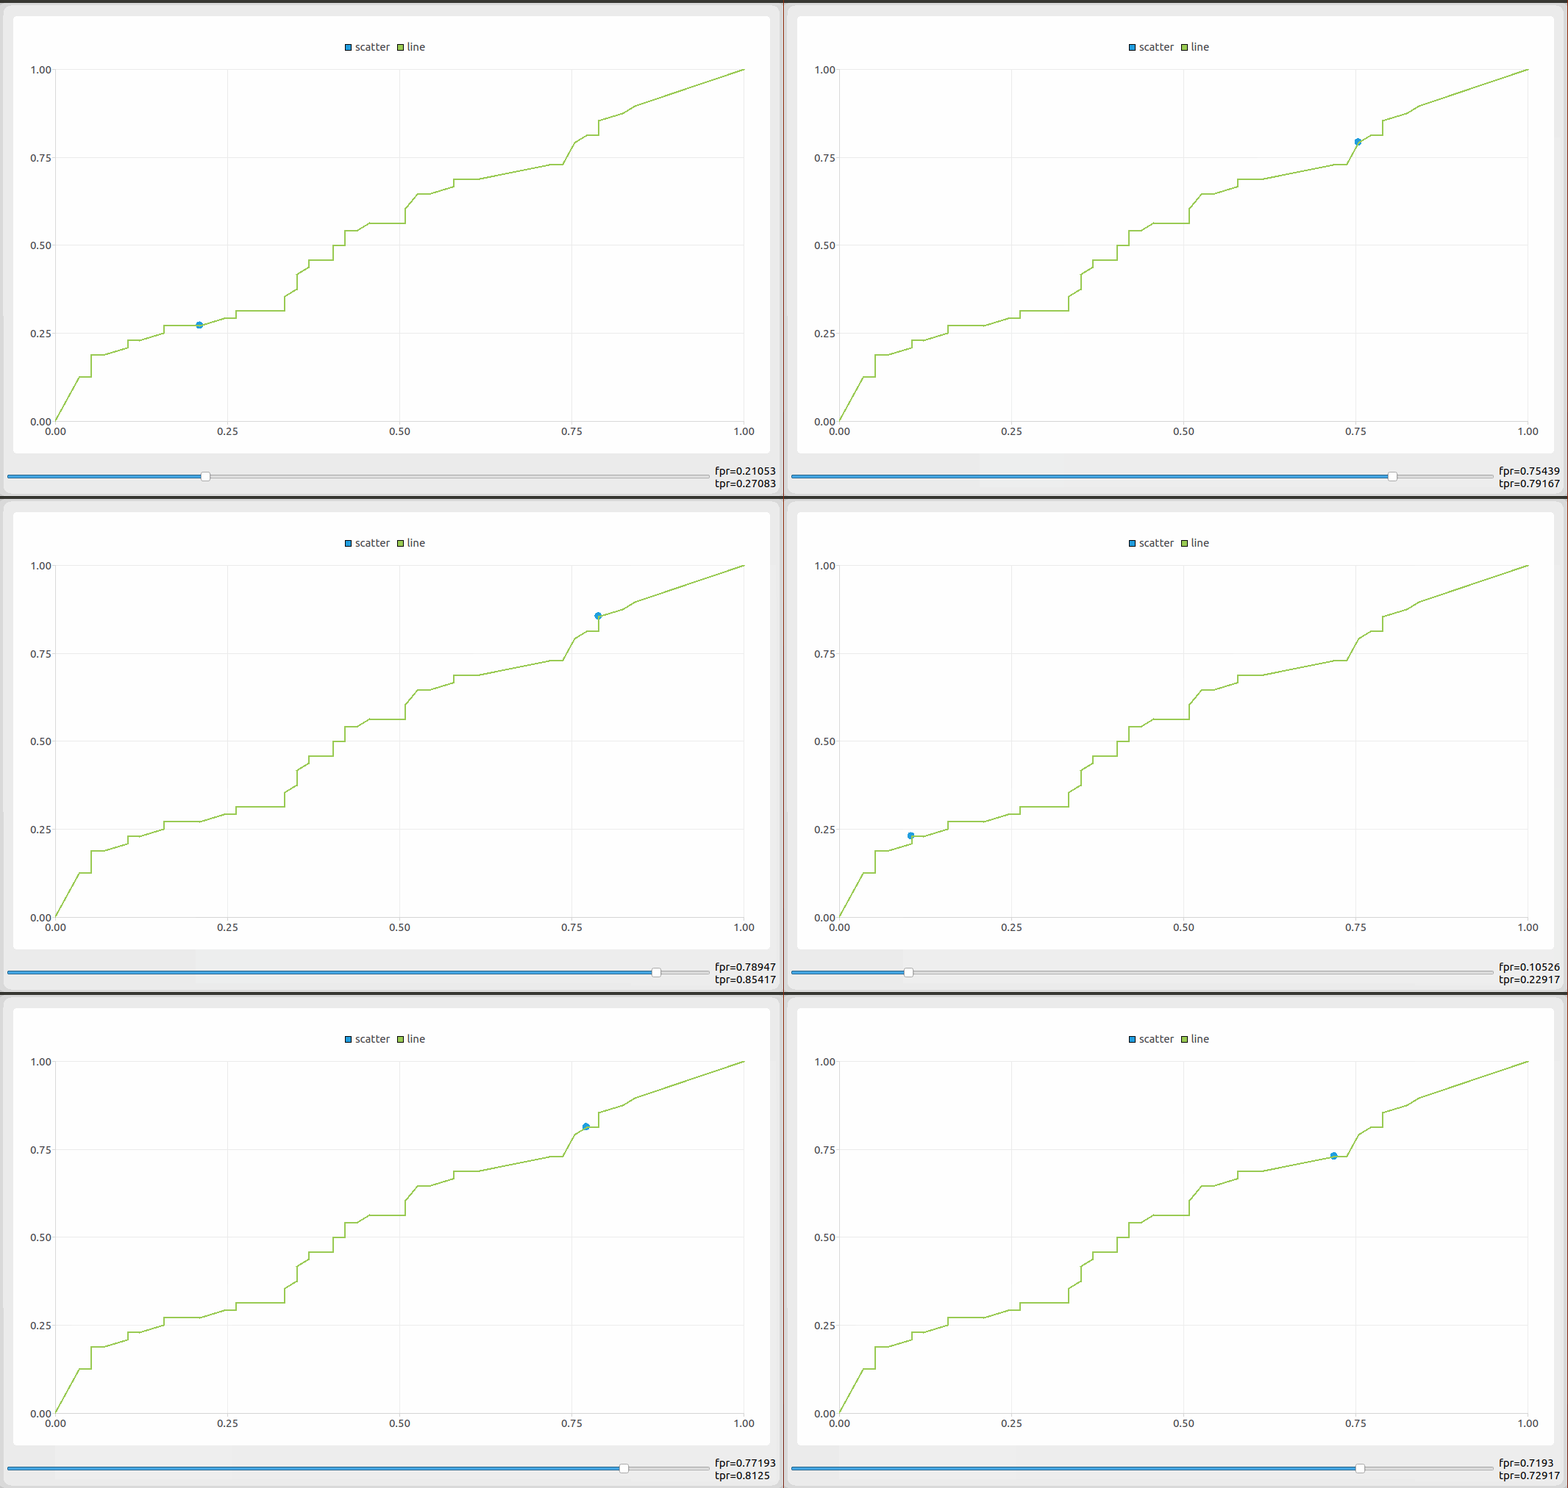
04.03.2022 posted "class curve_roc_" the class is in the file scatter_2period_.py
04.03.2022 posted "class candle_pyqt" the class is in the file scatter_2period_.py
in more detail...


