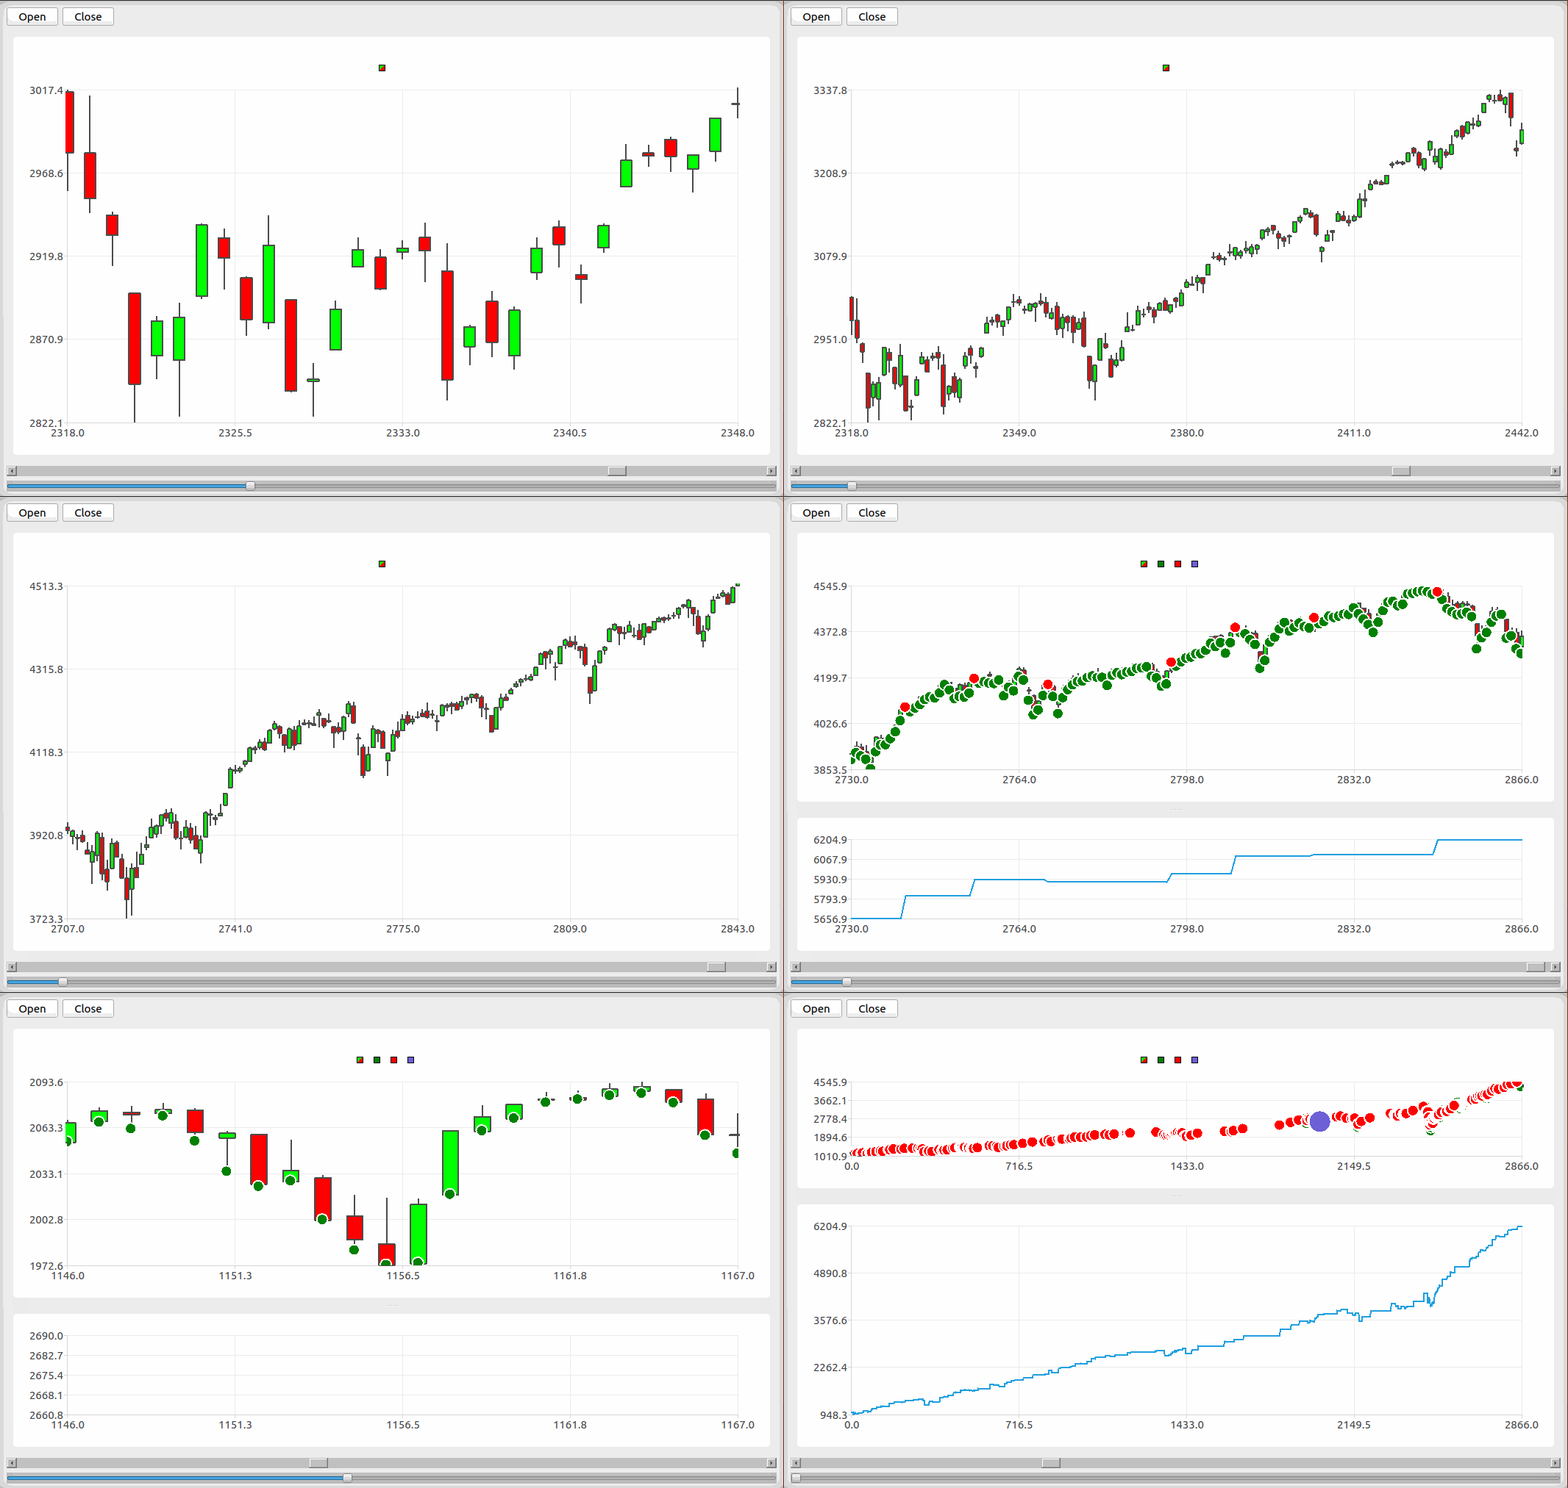
class candle_pyqt: Creates a candlestick chart with the ability to change the scale and scroll it. The "open_clicked" button creates
a one-period increment with a shift of one. Training is conducted during the training period and further classification using the
"GradientBoostingClassifier". The green dot classifies the growth, the red dot classifies the fall, the bold (large) designation of the
training period. Also, a window with a balance chart is added at the bottom, which is based on the inputs. The "close_clicked" button closes all graphical
series except the candlestick chart. parametr = [7, 50, 0.01]#parametr[0]-depth, parametr[1]-tree, parametr[2]-learning.>
Following libraries are used: PyQt5, numpy, sklearn, scipy, pandas_datareader.